Composites · FEA · Experiment · 2025/26 · Final-year research project, University of Bristol
Thin-Ply Composite Analysis
Does the Double-Double strength penalty survive when the plies get thin? Theory, manufacture, experiment and FE, combined to answer one question.
- Abaqus
- MATLAB
- Python
- eLamX
- Instron 1342
- SEM
Undergraduate research project (AENG30017), supervised by Prof. Michael R. Wisnom
- 4 × 32-ply
- Laminates manufactured
- 496 to 538 MPa
- Failure stress range
- 45 to 254 J/m²
- O'Brien energy release rates
- 65
- Automated tests
TC33/K51 spread-tow prepreg, 0.03 mm plies, autoclave-cured
All four architectures, failure strains 1.41 to 1.53 %
Within or below the Gc ≈ 200 to 500 J/m² critical range
Asserting the analysis pipeline's core properties
01 Overview
The research question
Conventional-thickness Double-Double (DD) laminates carry a well-documented unnotched tensile penalty relative to stiffness-equivalent quasi-isotropic (QI) laminates, usually attributed to elevated free-edge stresses, earlier matrix cracking and delamination.
This project asks whether that penalty is intrinsic to the DD architecture, or whether it is only a consequence of matrix- and interface-dominated damage mechanisms that thin plies suppress. It asks the same question of the classical strength penalty associated with ply blocking.
Each laminate is 32 plies at 0.03 mm, giving a 0.96 mm laminate. The blocked stacks contain the same proportion of each orientation as their dispersed counterparts, so their extensional stiffness (A) matrices are identical. That equivalence is the premise the whole comparison rests on, and it is asserted by an automated test rather than assumed.
- 01
Theory
CLT, ABD matrices, Hashin first-ply failure, O'Brien energy release rates
- 02
Manufacture
Hand layup, vacuum bagging and autoclave cure of four 32-ply panels
- 03
Experiment
Unnotched tension on an Instron 1342 with video-gauge strain
- 04
FE model
3D ply-by-ply Abaqus free-edge stress extraction
- 05
Statistics
Welch tests with Holm correction for multiple comparisons
- 06
Fractography
SEM identification of the governing damage mechanisms
02 Process
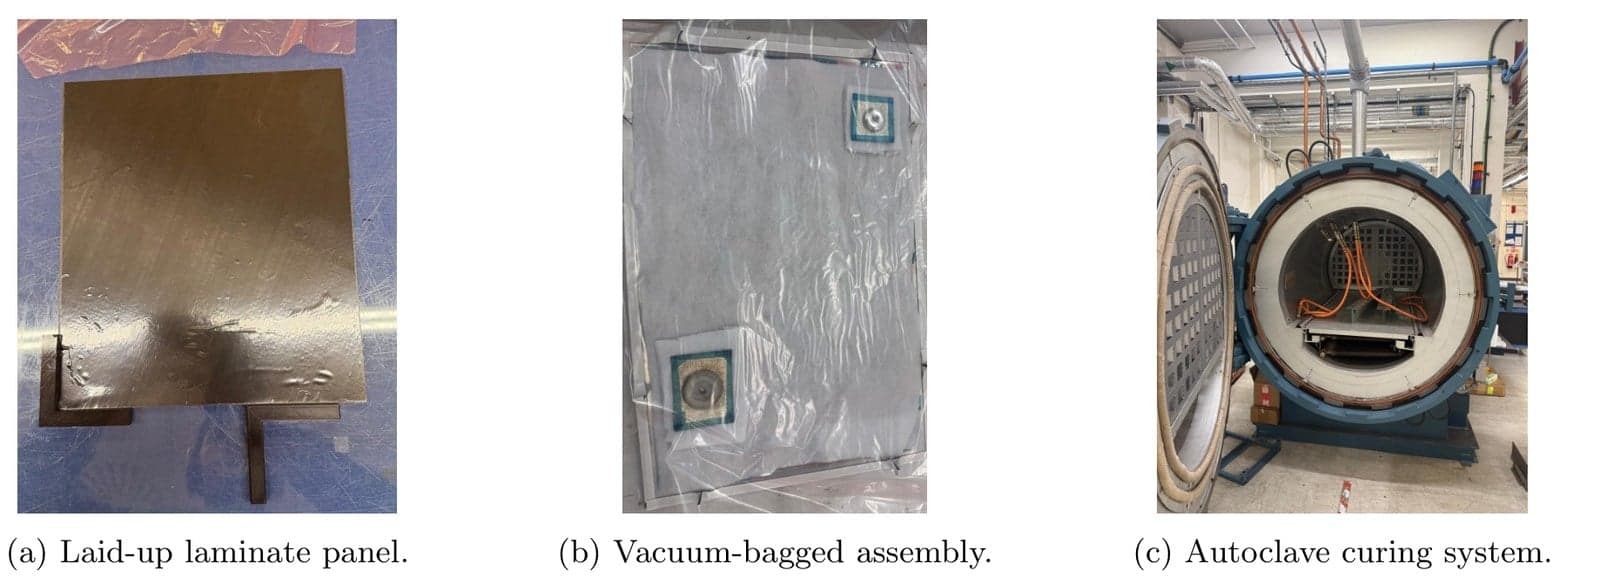
Manufacturing the panels
Panels were laid up by hand from TC33/K51 spread-tow thin-ply prepreg, vacuum-bagged and autoclave-cured, then cut into untabbed coupons.
Working at 0.03 mm ply thickness makes layup defects a live concern, and the repository documents them rather than editing them out. They are the reason results are ultimately interpreted comparatively rather than as intrinsic material strengths.
The defect record below is part of the engineering argument. It covers wrinkling after debulking, wrinkling concentrated on the positive-angle plies, fibre separation in the spread-tow material, and a ply repair where a second ply was laid over a broken one.
Defect record
03 Experiment
Tensile testing
The non-contact video gauge matters on a 0.96 mm coupon. A bonded extensometer or strain gauge would introduce exactly the local stiffening and stress concentration the experiment is trying to avoid. Coupons were run untabbed after preliminary tabbed tests failed prematurely at the tab ends.
04 Numerical
The 3D free-edge finite-element model
The FE work is the numerical half of the argument. If DD really carries an intrinsic penalty, it should show up as a more severe free-edge stress state than QI at matched in-plane stiffness.
Every one of the 32 plies is meshed discretely through the thickness. The free-edge problem is a ply-scale effect, so smearing the laminate into an equivalent shell would delete the very thing being measured.
Model & boundary conditions
Through-thickness mesh
All four laminates
QI blocked, signed
Two results come out of this. QI and DD develop genuinely different free-edge stress states despite matched in-plane stiffness, so the architectures are not interchangeable at the ply scale even when their ABD matrices say they are. Blocking also raises the local magnitudes in both families, which is the conventional explanation for the blocking strength penalty.
Feeding these fields into the O'Brien energy release rate gives per-interface values of 45 to 254 J/m², sitting within or below the expected critical range for this material system (Gc ≈ 200 to 500 J/m²) for three of the four laminates. The free-edge stresses are real and architecture-dependent, but mostly not large enough to drive delamination first. That is the crux of the whole result.
05 Results
What the experiment showed
All four laminates failed at similar global strains (1.41 to 1.53 %) and stresses (496 to 538 MPa). Blocked DD gave the highest mean, but the question worth answering is which of the differences are real.
Local ply strain at failure
Failure stress vs reference
Classical laminate theory converts the laminate-level measurements into something comparable against the material's own fibre allowable. Both architectures underperform their references and DD underperforms by more, which taken alone looks like the classic DD penalty. It is not. The shortfall tracks the grip-failure caveat below, and the architectures are statistically indistinguishable when compared against each other rather than against literature values.
Raw p-values
After Holm correction
That pair is what decides the question. Raw pairwise tests throw up differences, but once Holm correction is applied for the number of comparisons actually being made, almost all of them disappear. The headline QI-versus-DD difference does not survive it.
06 Mechanism
Fractography closes the loop
SEM of the fracture surfaces makes the mechanism visible directly. QI shows matrix-dominated separation localised at the 90° ply, so a single weak orientation is doing the failing. DD shows fibre fracture across all four orientations, with damage distributed rather than concentrated at one ply.
That is what the thin-ply suppression hypothesis predicts. With no weak matrix-dominated ply to fail first, the DD architecture loses the mechanism that conventionally penalises it. The statistics say the penalty is gone, and the fractography says why.
07 Methods
Reproducibility as an engineering deliverable
The reported numbers come from the MATLAB pipeline, which covers ABD construction, Hashin first-ply failure across all four modes, O'Brien energy release rates, and the Welch and Holm statistics. Because MATLAB needs a licence, the central calculation is also implemented in Python and runs against a clearly labelled synthetic sample dataset with no licensed software at all.
A 65-test suite asserts the properties the analysis depends on rather than just that the code runs. It checks that a symmetric laminate really produces a zero B matrix, that the A matrix is genuinely unchanged by blocking (the stiffness-matching premise of the whole comparison), that a unidirectional laminate recovers its engineering constants exactly, that Hashin returns unity at each allowable, and that the Holm implementation matches hand-computed adjusted p-values.
The complete write-up lives in the repository: methods, data, code, provenance and limitations.
github.com/Jadbadawi/thin-ply-composite-analysis